Genomic interpretation, engineered to be inspected.
One automated chain built on proven, open bioinformatics — extended with interpretation engines designed for auditability rather than opacity.
Ranked findings, with the reasoning attached
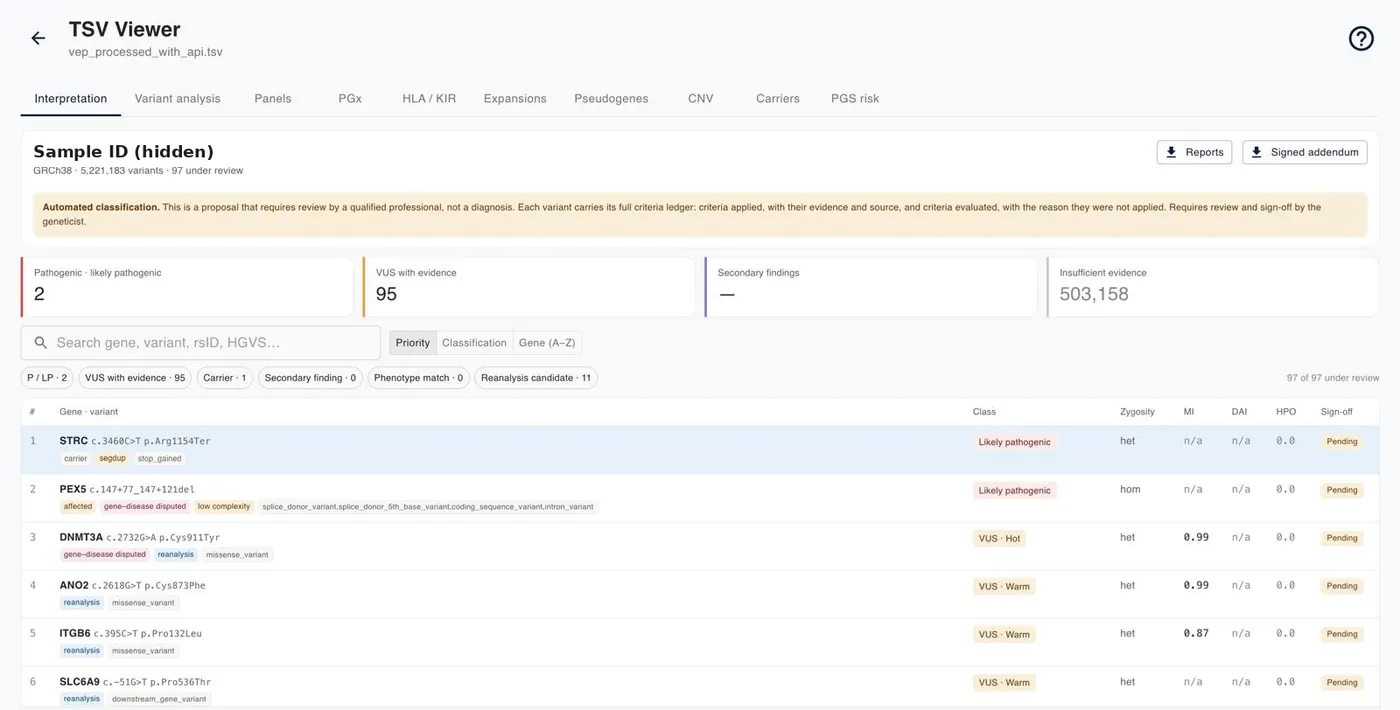
This is the screen a geneticist works in after the chain has run: every finding ranked by class, with its zygosity, its flags and the state of its sign-off.
The class is derived from the criteria, then signed by a person
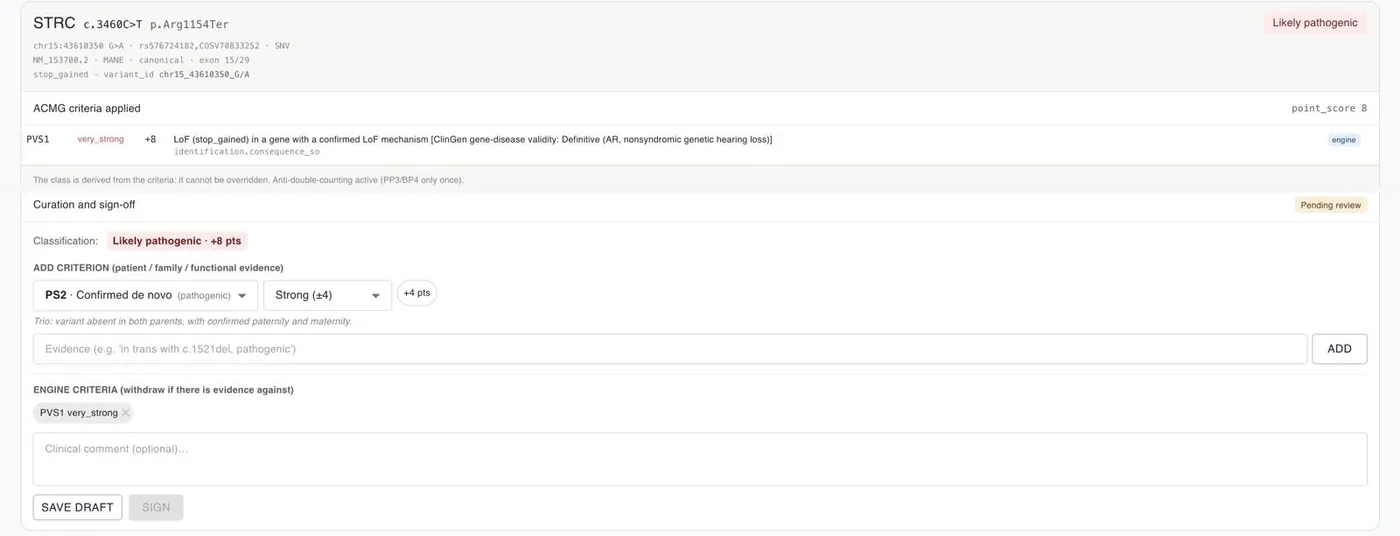
Each variant carries a ledger of the ACMG criteria applied and of those evaluated but not applied. The geneticist can add phenotypic, family or functional evidence, withdraw an engine criterion when there is evidence against it, write a comment and sign off. Nothing is issued as a research result until a qualified professional has reviewed it.
Six stages, each one inspectable
Innovare runs one continuous pipeline from raw reads to a signed report. Each stage is built on established tools and extended where genomic research needs more than a standard pipeline gives.
Quality recorded, not discarded
Industry-standard alignment and calling, with mapping quality and coverage recorded per region, so an ambiguous mapping is reported as unresolved rather than silently dropped.
A ledger, not a verdict
A Bayesian ACMG interpretation model aligned with ClinGen SVI recommendations, which classifies variants and records every criterion applied — and every one deliberately not applied — as an auditable ledger.
ClinGen SVIBayesianCYP2D6, interpreted on its own terms
A specialised locus-specific analysis, so the locus is interpreted on its own terms instead of inheriting a result from a general-purpose variant file.
CPIC · DPWGAncestry inferred, then calibrated
Scoring against reference panels with explicit ancestry inference, so a percentile is interpretable across Iberian and admixed Latino populations.
275+ traitsDeep-linked to the source
Annotation enriched with public clinical databases and curated gene–disease knowledge bases, deep-linked back to the primary source for every call.
ClinVargnomADRead level, in the portal
An embedded read-level browser lets a geneticist inspect any variant against the aligned reads before signing, without leaving the review.
read-levelWhere the scientist actually works
Once the chain has run, the findings land in an interactive workspace built for the person who has to decide what goes into the report — and for the research group that needs to explore a cohort before anything is reported at all.
Filter on your own criteria
Configurable filters over the complete result table: search by condition or by variant, and filter through standardised medical ontologies — UMLS, MeSH, Disease Ontology and HPO. Simple and compound sorting, with paginated navigation over tables of any size.
UMLS · MeSHDO · HPOA shortlist that survives the session
Row-level selection that persists across pages, filters and re-sorting, with select-all, invert and clear. A shortlist can be built over several passes through the data without losing it, and the counter tells you how many of your selections the current filter is hiding.
persistent selectionThe source, one click away
Where a valid rsID is present, direct links to dbSNP and SNPedia are generated automatically, so nobody retypes an identifier into a search box. Where no rsID can be extracted, the workspace says so explicitly instead of leaving a blank cell.
dbSNP · SNPediaAggregated polygenic view
Aggregate polygenic scores by condition, gene, variant or ontology, either exploratory across the whole dataset or targeted at a selection. Partial and multi-term search included. It answers where the polygenic load actually concentrates, rather than variant by variant.
exploratory & targetedKnow the dataset before you read it
A statistics panel with record counts, ranges, means and standard deviations for the numeric columns, and the number of distinct conditions present. A fast read of the shape of the data before committing time to it.
summary statisticsExport built for reporting and reuse
Export every row that matches the current filter, or only the ones you selected, choosing the columns. TSV that can be re-imported, formatted XLSX for further analysis, and PDF with orientation, font and layout control for the record.
TSV · XLSX · PDFStandard inputs, one reference
FASTQ, BAM and VCF from whole-exome sequencing, targeted panels and microarrays, on hg38. Required fields are validated on upload and reported explicitly when something is missing, so a malformed file fails at the door rather than halfway through an analysis.
Named access, defined roles
Every account carries a defined set of permissions, so confidentiality and traceability of genomic and associated research data hold across a team rather than depending on who happened to open the file.
Findings are linked to a continuously updated knowledge base covering more than 40,000 conditions and 4,000 drugs.
Every tab says what it cannot see
Pseudogenes, copy number, repeat expansions and carrier screening are where a short-read pipeline can fail without saying so. Each of these tabs opens with what the method can and cannot conclude.
Phenotype and drug-level guidance, gene by gene
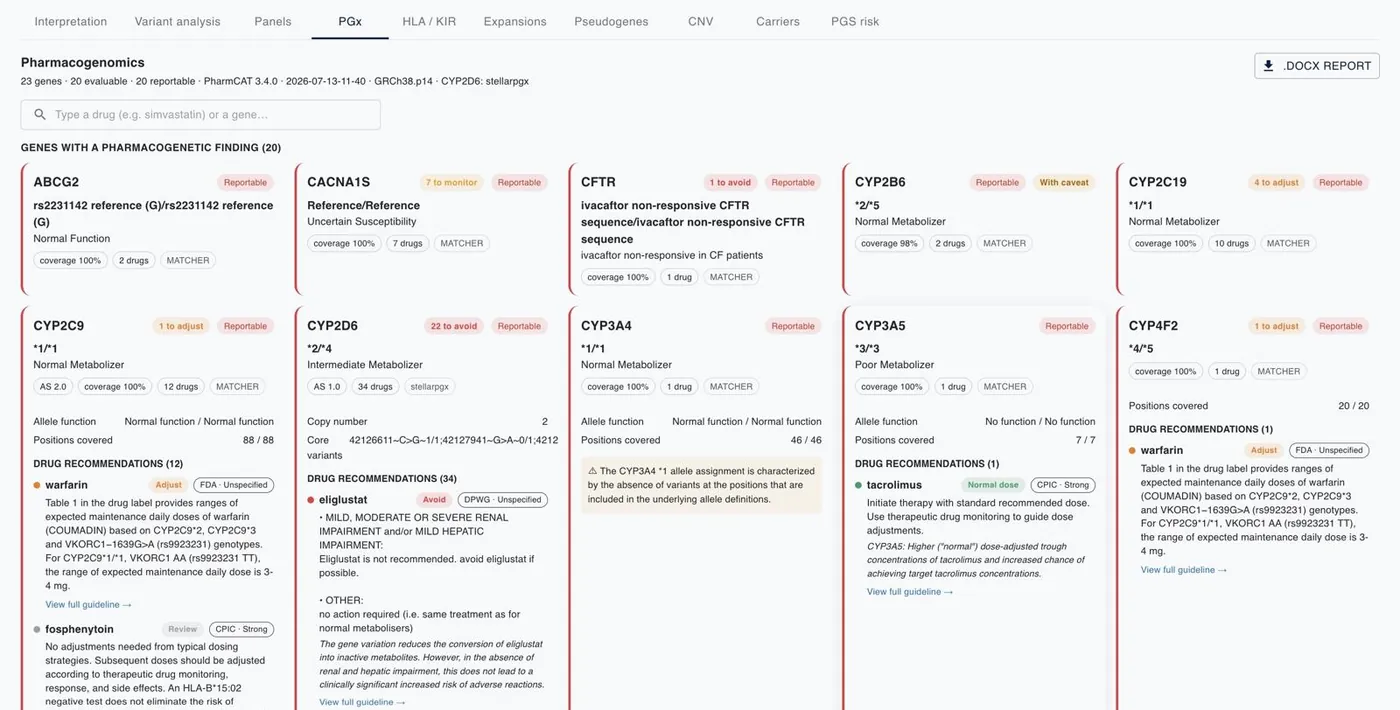
One card per pharmacogene with the inferred phenotype, coverage of the positions assessed and the drug recommendations tied to that phenotype, with their source (CPIC, DPWG, FDA).
A gain without dosage curation is not benign
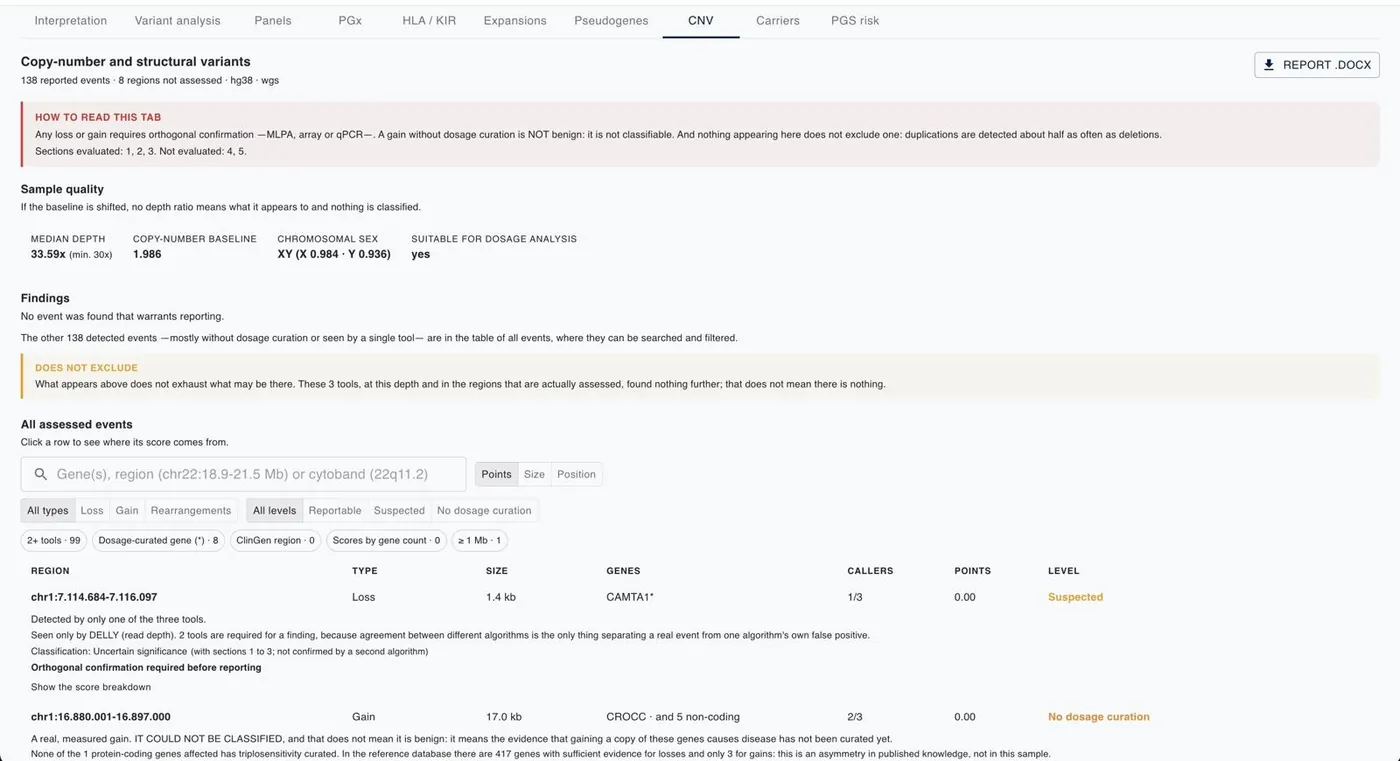
The tab opens by stating that any loss or gain requires orthogonal confirmation, and that nothing appearing here excludes an event. Events seen by a single tool are labelled as suspected, not reported.
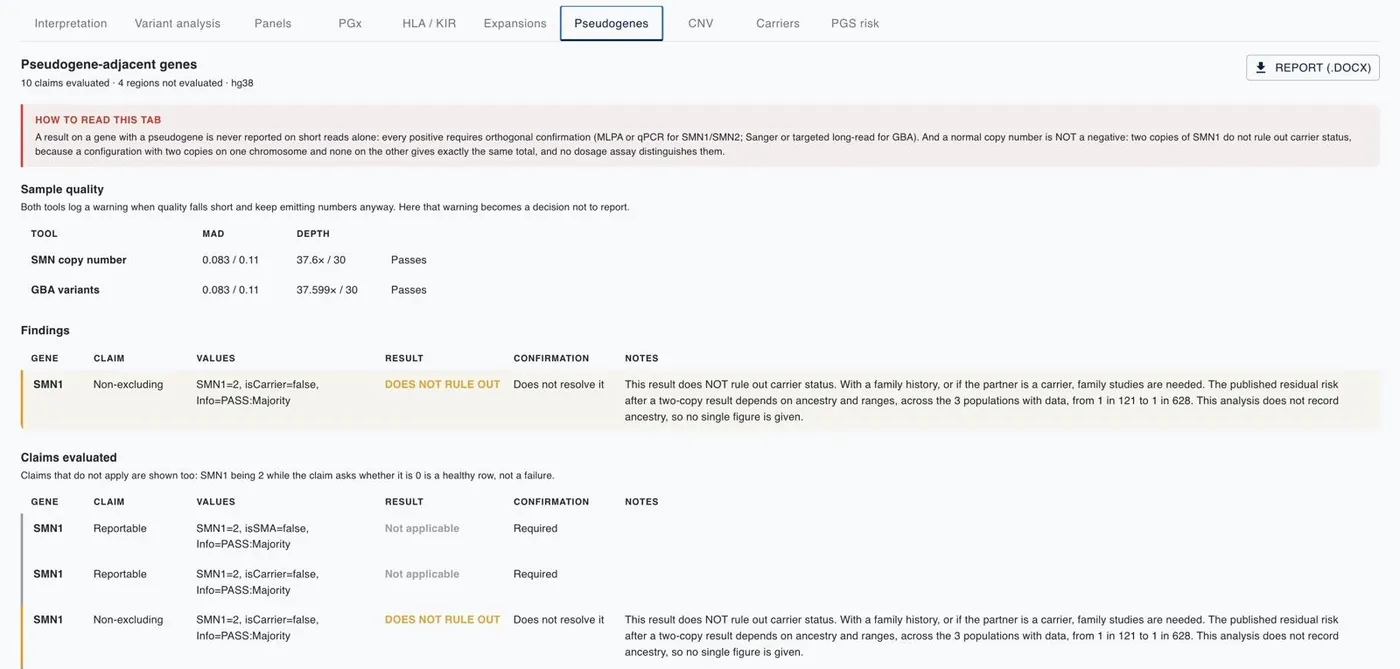
A normal copy number is not a negative
For genes with a pseudogene, a positive is never reported on short reads alone. The tab says explicitly when a result does not rule out carrier status, and why.
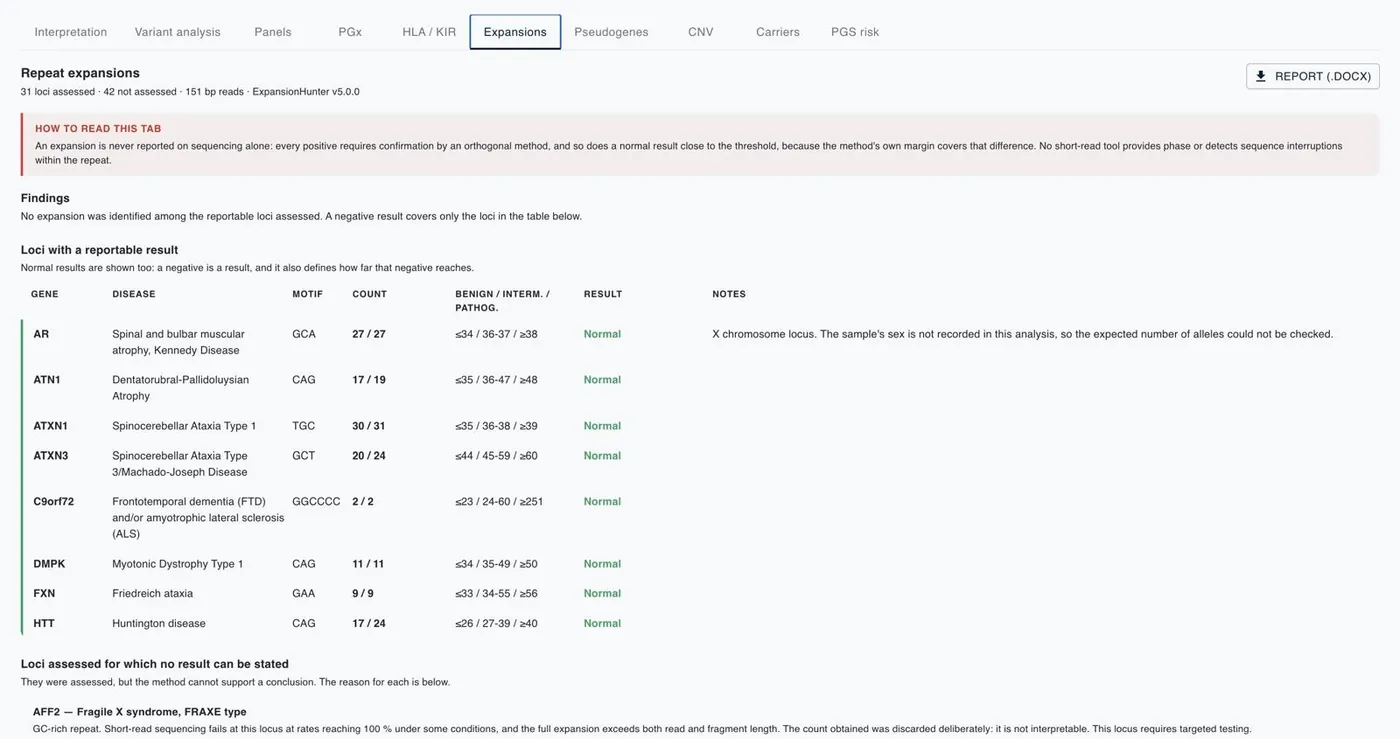
A negative covers only the loci in the table
Normal results are shown, because a negative also defines how far it reaches. Loci where the method cannot support a conclusion are listed separately, with the reason for each.
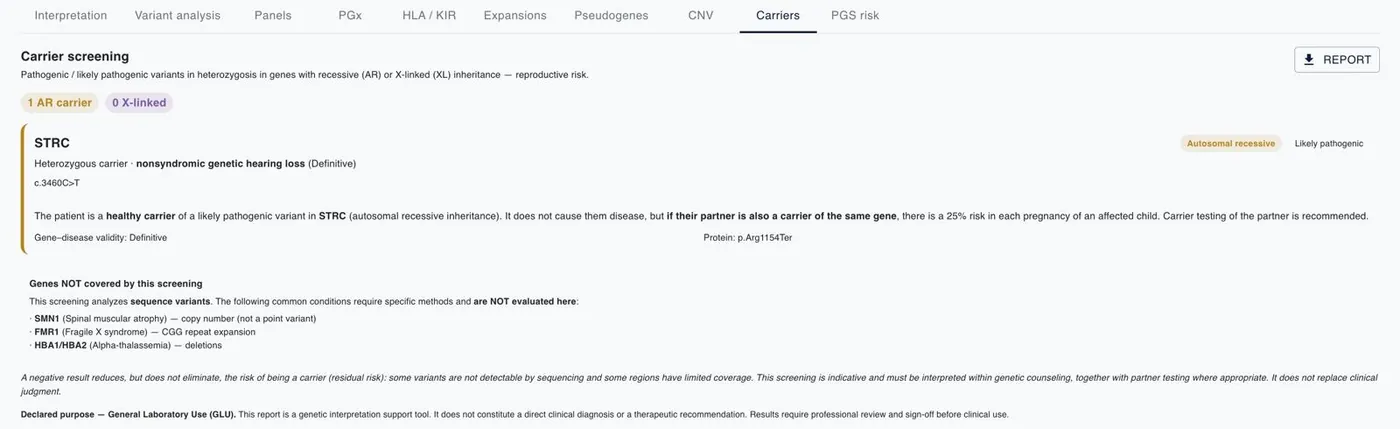
What the screen does not cover, stated up front
Heterozygous variants in recessive and X-linked genes, with the reproductive-risk reading in plain language. Genes that need other methods, such as SMN1, FMR1 and HBA1/HBA2, are listed as not evaluated here.
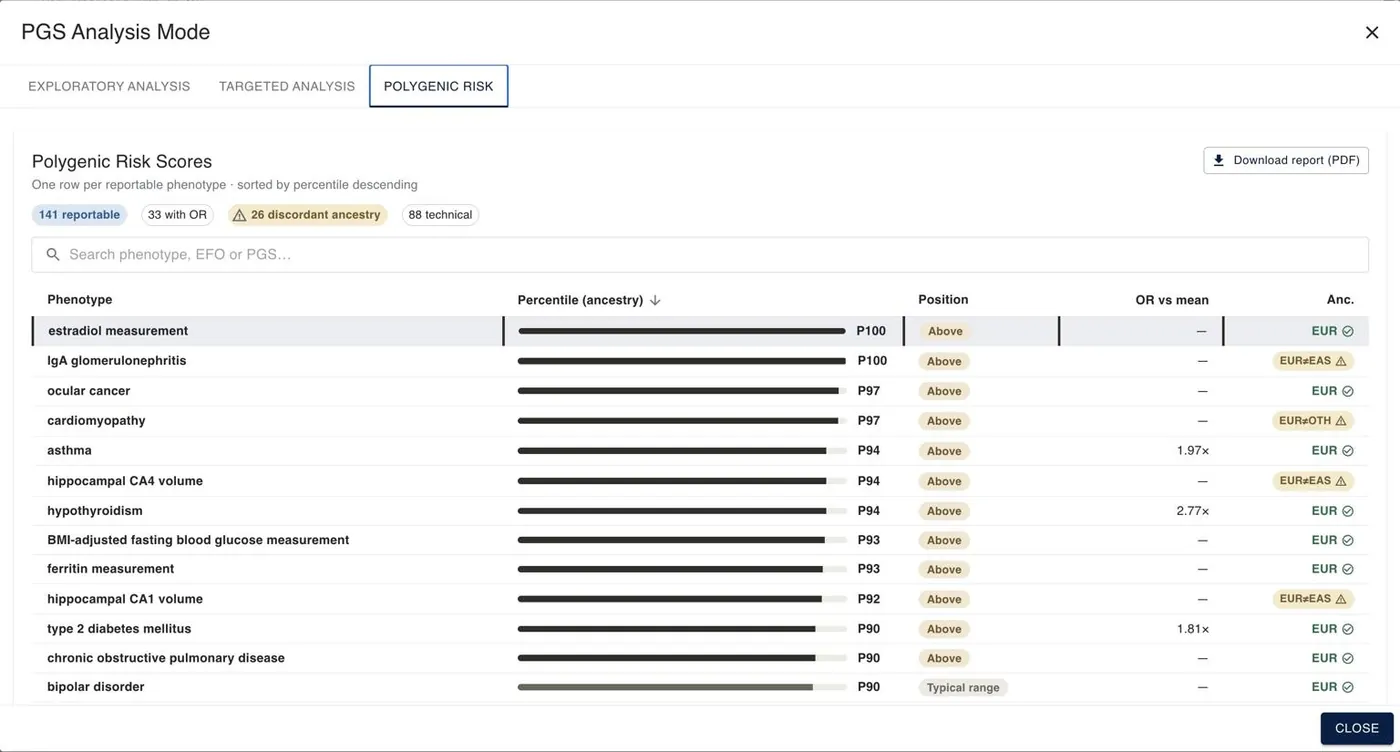
Percentile, with the ancestry check beside it
Ancestry-adjusted percentiles per phenotype, and a flag where the inferred ancestry differs from the one the score was built on.
Why CYP2D6 needs a specialised locus-specific analysis
The CYP2D7 pseudogene keeps very high sequence identity with CYP2D6. A short read in those blocks maps equally well to both, so the aligner assigns MAPQ 0 — and the caller drops it before interpretation begins.
In our measurement, a large fraction of the reads at this locus sit at MAPQ 0. Schematic representation; metrics measured on our own samples.
A specialised locus-specific analysis
Designed to improve interpretation in complex genomic regions, where a general-purpose path cannot support a reliable result.
Structure reported, not inferred
Whole-gene deletion and duplication are reported explicitly, with the copy number stated, instead of being left implicit in a variant list.
Phenotype, not a lookup table
CPIC and DPWG implications are tied to the metaboliser phenotype and the activity score that were actually inferred for that sample.
Coverage as governance
An independent step decides evaluability per gene before a report exists. It determines what can be asserted, and what cannot.
What the architecture is actually optimised for
Make the analytical limits visible
Pseudogene regions, repeat expansions and copy-number events are exactly where a linear short-read pipeline can fail without saying so. Innovare records mapping quality and coverage per region and reports an unresolved region as unresolved, so a professional never has to guess whether a clean result was actually examined.
Make interpretation auditable
An engine that outputs only a verdict is a black box. Innovare records its full reasoning as a ledger, so the geneticist reviews how a classification was reached — not just what it was — and can adjust it before signing.
Calibrate for the real population
A polygenic score trained on one ancestry can mislead in another. Innovare infers ancestry explicitly and calibrates accordingly, with attention to the Iberian and admixed Latino populations our clients serve.
See the chain run on your data
Bring one representative case — ideally one where you suspect the answer was never actually computed.